| Setting impedance limits for best repeatability & reproducibility | |||
Application Note AP141
Setting impedance test
limits so you obtain accurate results and best R&R
Background
Polar CITS impedance test systems are easy to set up and use. However care in setting up and understanding the test regions can yield improved measurement accuracy and better R&R
First – understand what is displayed
The test area shown on the 50 Ohm coupon on the right shows an ideal situation. And, to help understand what you are seeing you need to know each area of the trace under test. On the left hand side between 0 and 1.5" the trace is the end of the test probe.
The small bump at 2.0" is caused by the impedance discontinuity between the probe and the test sample. This can vary depending on the condition of your test probe, and the quality of the test connection to the sample trace.
Look carefully between 4 and 5 inches. Though this area is almost completely flat, you can just see a pixel high lift for around 1". This is not your coupon but a secondary reflection of the probe interconnect aberration. Good probe connections minimise this and make for best R&R.
The rest of the trace is almost flat except for the last inch or so. Here you see the trace start to rise. Again this is not due to impedance increase at the end of the trace, simply that the high frequency components of the pulse travel faster and their reflection is seen as a rise towards the end of the test coupon
When setting test limits you need to define an area for testing that is outside of these regions which are influenced by effects other than the impedance of your trace.
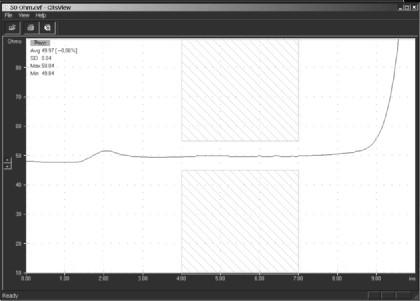
Impedance test TDR trace of 50 Ohm sample coupon
Look now at a 75 ohm trace
Look carefully after the first rise in the pulse, do you see a plateau before the pulse rises again and flattens out? This plateau is present as the TDR pulse takes some settling time to achieve its full value after the impedance transition. To get the most accurate result you should set the limits to start measuring after this plateau, but before the rise at the end of the coupon.
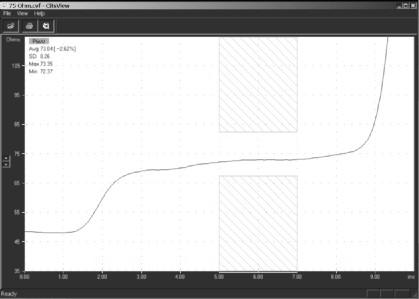
Impedance test TDR trace of 75 Ohm sample coupon
Watch out for:
Setting your test points on a poor quality test coupon — it is always handy to have a set of reference impedances in the form or precision semi rigid cables to give you an idea of how an "ideal" impedance looks with your TDR. This has the added benefit of allowing you to verify your TDR is in perfect condition from time to time.
Large interconnect aberrations (bumps) or dips in the end of the trace — these may be due to poor coupon design, connecting through a via with large pads, or extending the connections to the test trace beyond the extents of the ground plane.
Hint:
Measure your coupon from both ends if possible when setting up the measurement area. This will help you see if the coupon measures the same from both ends. You need to check if an upward slope is because of pulse settling time or because of trace taper.
When you are building controlled impedance boards for the first time, you may like to section the board in several places, run the data back into a field solver like the Si8000 and plot the predicted Zo v distance along the trace. Correlating this data with your test data will prove invaluable as you start to understand your process.
Now lets look at a 28 ohm trace (typically used in Rambus® applications)
Look carefully after the first fall in the pulse, do you see a plateau before the pulse falls again and flattens out? In fact just the opposite of the effect you saw on the 75 Ohm trace. In the same way as for the 75 Ohm trace you need to wait for the pulse to fall to its minimum level before setting the test limits.

Impedance test TDR trace of 28 Ohm Rambus coupon
Finally, here is a 130 ohm differential trace
Look from left to right along the trace, the trace enters the screen from the left (the end of the probe) then dips down to about 70 Ohms; this dip can be caused by too large a via on the coupon, which appears as a capacitor. Certain probe configurations can also contribute to this.* The trace then rises up from the launch until it settles (in the area tested denoted by the hatched test limit area.) Setting the limits before the pulse has settled means you are not accurately measuring the impedance, as your measurement will still be under reading because the TDR pulse is recovering from the large interconnect discontinuity. Please also refer back to the hint above – highlighted in yellow.
*Ask your polar distributor for details of the latest IPD probes which can help minimise this launch discontinuity.
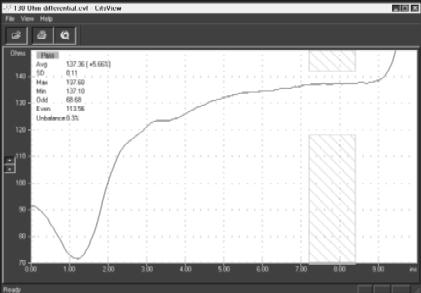
Impedance test TDR trace of 130 Ohm Differential coupon
If you own a Polar CITS system you can examine the above TDR traces in more detail. Download the following files:
50 Ohm.cvf 75 Ohm.cvf 28 Ohm Rambus.cvf 130 Ohm differential.cvf
Modifying designs
It is important to maintain a good dialog between the original designer of impedance controlled boards and the fabricator. To assist in this process the Polar Si8000b field solving impedance design system can goal seek new values and graph sensitivity to changes in build parameters. You can also use the Si8000 to graph predicted impedance over distance as described above.
More information? Further information on measuring PCB controlled impedances or field solving impedance design software is available from: ken.taylor@polarinstruments.com