|
|
|
|
|
|
Displaying s-parameters with Smith charts on the Si9000
Application Note AP192
|
|
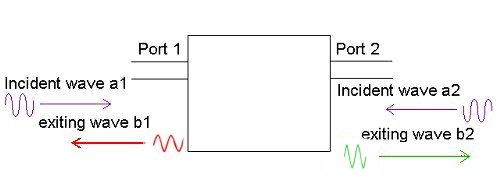
Si9000 s-parameters and Smith charts The Si9000 v7 and later allows graphical representation of s-parameters S11 and S21 via a Smith Chart, a widely used tool for graphic solution of transmission-line networks. The Smith Chart displays reflection coefficient in terms of constant normalised resistance and reactance circles. Recall that a linear network can be characterised by a set of simultaneous equations describing the waves, b1 and b2, exiting from each port in terms of incident waves, a1 and a2,
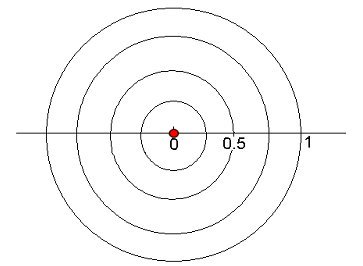
where s-parameters: S11 = b1 / a1 S-parameters can be graphed in several ways; one option is to use two graphs (magnitude v frequency and phase v frequency) to represent one s-parameter. Another popular method, described briefly here, is via the use of Smith Charts. Smith Charts A Smith Chart is a polar plot with several different scales/axis overlaid onto the graph. In this note we briefly consider an important scale, implied but not drawn on the Smith Chart, that of reflection coefficient, rho. Consider the following graphs of reflection coefficient, rho. Smith Charts are constructed within the circle described when rho is unity.
A point plotted at the origin shows no reflection, i.e. a transmission line perfectly terminated.
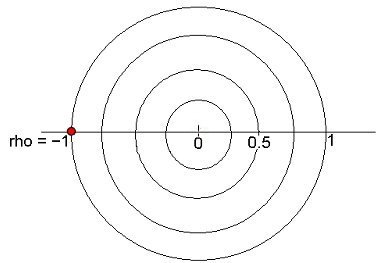
Commonly, a point plotted at the left-hand edge shows 100% –ve reflection, i.e. unity reflection with 180 degrees phase change, implying a transmission line terminated with a short circuit.
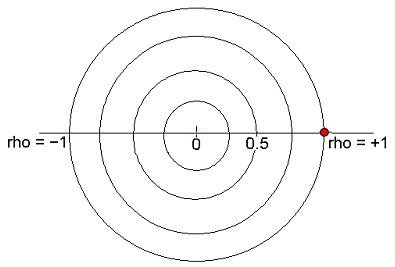
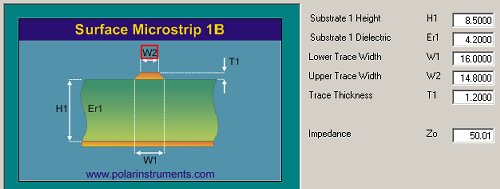
Similarly, a point plotted at right-hand edge shows 100% +ve reflection, i.e. unity reflection with no phase change, implying a transmission line terminated with an open circuit. A point plotted anywhere on this circle, a reflection coefficient of unity, shows a perfect reflection at different phase angles. Plotting s-parameters on the Si9000 Smith chart Consider a 50 Ohm structure
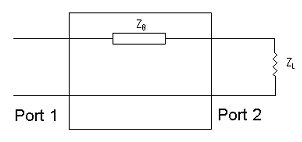
The structure can be represented as a transmission line (terminated in ZL = 50 Ohms) and the s-parameters of the network/black box can be obtained.
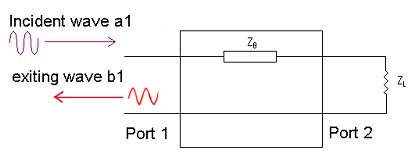
Plotting reflection coefficient
S-parameter S11 = b1 / a1 S11 of this surface microstrip would plot as a dot in the centre of the Smith chart — no reflection
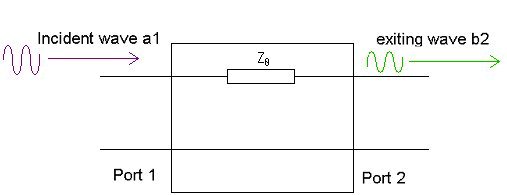
Plotting transmission coefficient
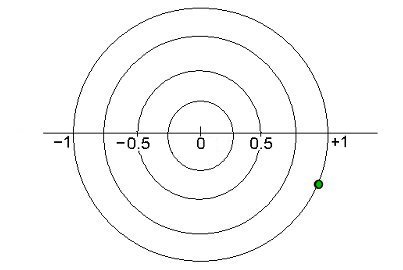
S-parameter S21 = b2 / a1 In a perfect system there is no loss and the signal passes through the transmission line unattenuated:
A single frequency reading of S21 of our surface microstrip would plot as a dot somewhere on the outer circle of the Smith chart.
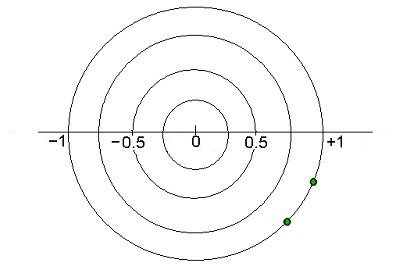
Where this dot is plotted would depend on the phase shift through the transmission line. If the frequency were increased, and other S21 frequency readings obtained, the magnitude of S21 would still be 1 but the phase shift would change.
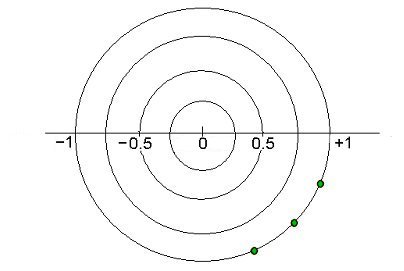
Adding more S21 readings at increasing frequency As we plot more S21 readings at increasing frequency we note that the plotted graph increases in a clockwise direction — typical of a transmission line.
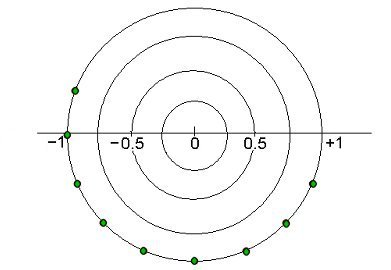
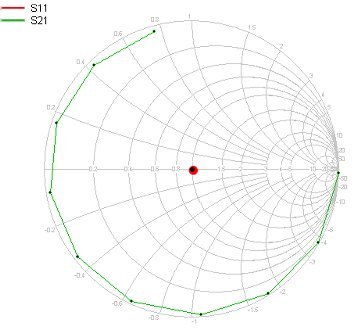
The Si9000 Smith Chart Plotting the real response S11 and S21 of our 50 ohm surface microstrip shown above produces the following picture on the Si9000 (in this example only 10 points are plotted). The S21 graph starts at the right hand edge at 100Mhz and circles around with the last plot at 15GHz.
The previous graphs plotted an ideal network with no loss. This plot shows this transmission line with a small amount of loss, as the 15GHz point is no longer sitting on the unity outer circle. If the loss increases with frequency the reflection coefficient becomes smaller and the plotted line spirals inwards. Summarising …
|