|
|
|
Modelling and measuring impedance on fine line traces
Fine traces are now in common use and we at Polar see an increasing number of users attempting to reconcile differences between modelled and measured impedances – especially on flex coupons. Some board shops, for example, are measuring the impedance – ignoring the DC resistance component – and then sectioning the sample and using a field solver to goal seek for Er – and while Er may be a partial contributor it could be a fallacy to blame Er for all of the observed mismatch. Here, Er may be innocent but because it is relatively hard to measure it is used as a convenient adjustment factor to null out measured and modelled accuracy. If you are doing this it might be worth measuring the DC trace resistance before you draw an incorrect – or partially incorrect – conclusion...
In this note Polar's CITS880 controlled impedance measurement system is used to measure and display the impedance of 50 Ohm coupon traces – the Si8000m/Si9000e field solvers are used to model the associated structure and to fine tune and correct the structure for the next build. However, be careful before jumping to conclusions…
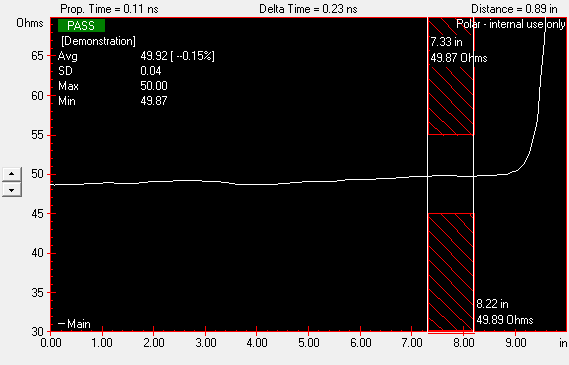
The graphic above is a screen shot of the Polar CITS880 displaying the impedance curve of a lossless surface microstrip 50 Ohm trace. You can use Polar's Si8000m/Si9000e controlled impedance field solvers to model the structure (below.)
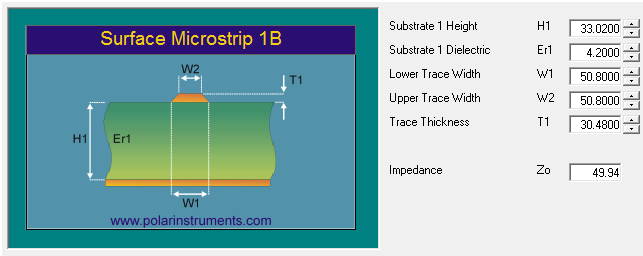
The graphic above illustrates the Si8000m calculation for the 50 Ohm lossless trace above based on the data sheet value of Er of 4.2 (trace dimensions are in microns.)
Impedance curves with sloping traces
As PCB traces reduce in width, their DC resistance will become a factor in the display of overall impedance. Consider the impedance graph below for a fine line trace on a test coupon.
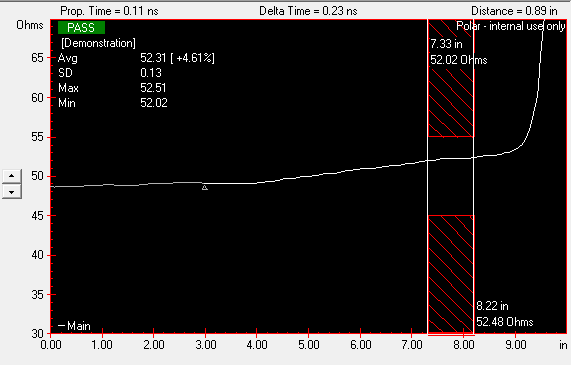
The CITS880 display above represents a 50 Ohm trace with a slope of 0.5 Ohms/inch, the impedance rising over the trace length to 52 Ohms. This structure has a 2 Ohm lift on the impedance because of the DC resistance of the trace.
Interpreting sloping traces
The slope of an impedance trace needs to be interpreted with care as a sloping trace can be due to taper in the trace or resistive loss. Some board manufacturers, for example, assume the DC resistance of a coupon trace to be so low as to be negligible and therefore are taking this reading (erroneously) to represent the lossless impedance.
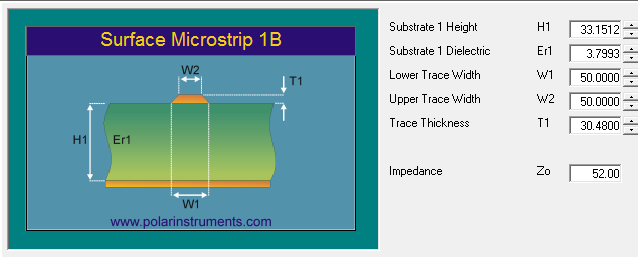
Modelling the trace with the Si8000m, the board manufacturer assumes (perhaps incorrectly) an error in Er – so employs the Si8000m's goal seek function to arrive at an Er value to produce the measured impedance value and use the goal seek value to predict the next build – see the Si8000m model below. This gives the impression that the Er for this structure is 3.799 rather than 4.2 It would be more logical, however, to remove the DC resistance before goal seeking.
Note also that impedance only varies as the root of Er so it really is only a second order effect as the Er has to change by a ratio of the impedance squared to remove the “apparent” error caused by the DC resistance.
Consider the impedance graph below.
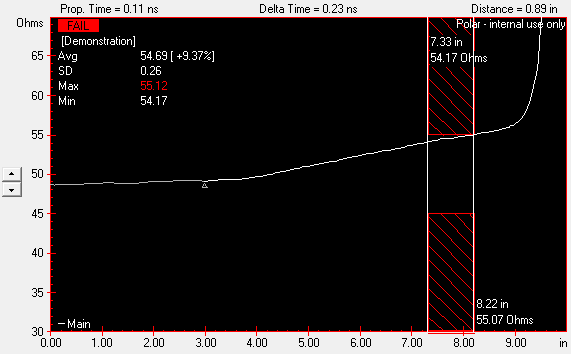
In this case the slope is even greater; the CITS880 displays the impedance graph of a 50 Ohm trace with a slope of 1 Ohm per inch. The CITS800 returns a value of 54.69 Ohms.
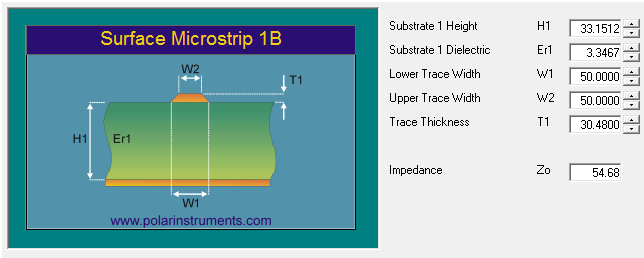
Again, goal seeking for a value of Er to produce the measured impedance results, for the trace above Er now has to be pushed even further down from 4.2 to 3.3.
Designing with fine lines
Most impedance controlled PCB specs assume lossless traces, but even if the trace is only specified at moderate speeds long before dielectric loss comes into play, the reducing geometries and thinner boards in current use along with more layers in a given overall thickness means that the DC resistance of a PCB trace (which could reasonably be ignored with the geometries and copper weights in use only a few years ago) is interfering with the measurement of instantaneous impedance.
It is quite possible that the impedance trace has developed a significant upward slope and when the average impedance is taken after the initial aberrations have been allowed to settle the impedance reading is comprised of the instantaneous impedance PLUS the DC resistance.
Designing the coupon for DC measurement could help here: provide probe access at both ends of a test trace and measure the DC resistance with a precision meter. You will get an idea of how much resistance per inch is being added as an error component on top of the instantaneous impedance; on differential traces the value is doubled.
Summarising, fine traces are widely used, especially when designing with flex and flex-rigid coupons, and DC resistance should not be ignored when interpreting sloping impedance traces or attempting to reconcile differences between modelled and measured impedances. If you are facing this issue, consider measuring the coupon trace DC resistance before remodelling for the next board spin...