|
|
|
|
|
|
The effect of risetime on the TDR measurement of impedance
Application Note AP168
|
|
TDR risetimes and impedance measurement This application note is intended to give guidance to those making impedance measurements on industry standard 6 inch long coupons. The note will show that in this situation the use of risetimes shorter than 200ps will yield no advantage and in fact may be more difficult to use. In order to minimise losses and to deliver the fastest possible risetime to the coupon, the connection from the TDR head to the coupon was made using a short (300mm) low loss cable and edge launch SMA connector. It down the risetime of the pulse applied to the test coupon. A typical 3' cable and a probe will add 150ps to a 35ps pulse (round trip risetimes). Measurements were made using a Tektronix CSA803 with SD24 TDR head. This achieved a fastest risetime of approximately 50ps into the coupon. The filter facility of this instrument allows the simulation of a slower risetime by filtering the signal. This was used to obtain impedance measurements at a risetime of 200ps.
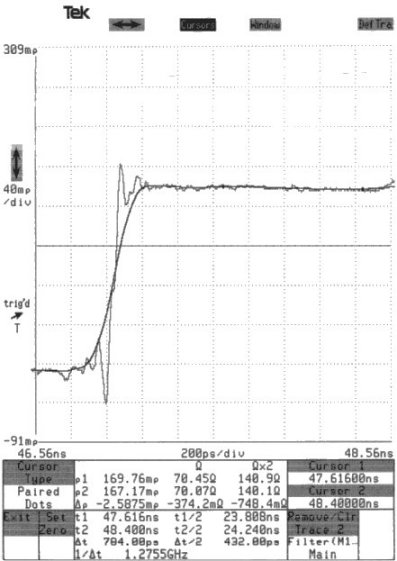
This display shows two traces superimposed, both of the same coupon of 75 Ohm nominal impedance, one at fastest risetime and one filtered to 200pS. The waveform commences at the left at the 50 Ohms of the cable and rises to the 75 Ohm of the coupon. At the extreme left the waveform can again be seen to commence to rise towards the open circuit value. The faster risetime pulse is subject to considerably more aberrations and reflections. This makes the pulse unusable for the first 200pS
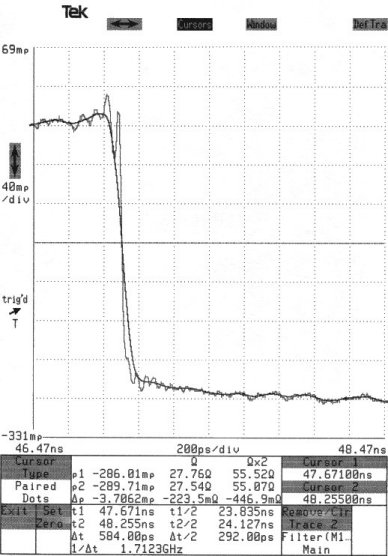
This shows the waveform that results from taking measurements on a 25 Ohm nominal coupon. In many ways it is an inversion of the diagram above. There is slightly more loss in this coupon resulting in a trace which is slow to flatten. It is a frequently used convention to take measurements between typically 50% and 70% of the length of the coupon, as this is where the flattest part of the trace is to be found.
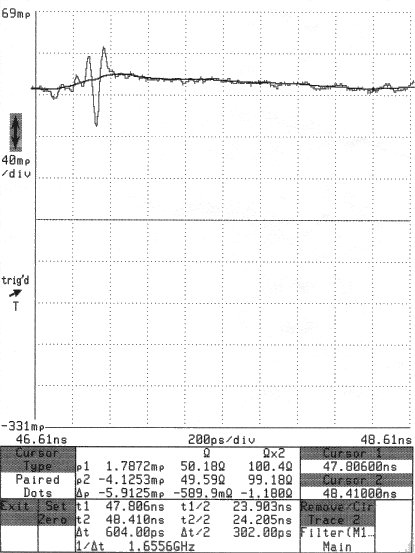
This shows the result of measuring a 50 Ohm trace and the aberration seen is due to the connector making the transition from co-axial to pcb.
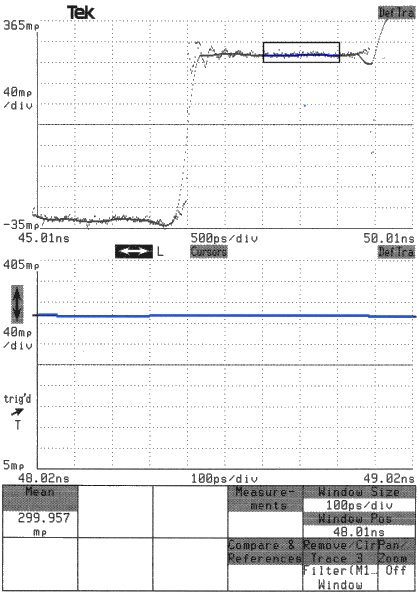
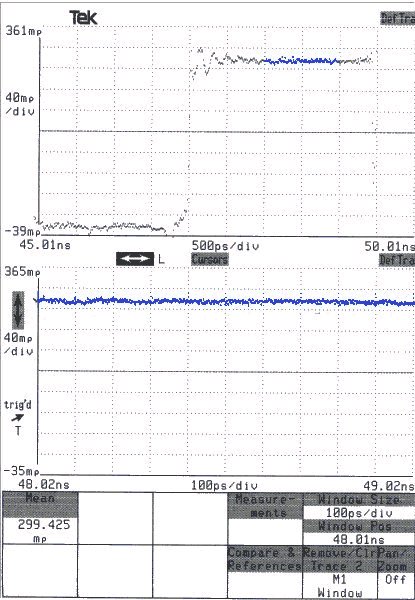
This illustrates the measurement of impedance on a 100 Ohm nominal coupon. The upper diagram shows both the fast and slow risetime waveforms while the lower diagram shows the expansion of the measurement zone from the slow trace (shown in blue). This is averaged to give a value of 299.957 millirho (92.8 Ohm)
This shows the expanded measurement zone of the fast trace and the average result for this of 299.425 millirho (92.7 Ohm) This shows that the effect on the measurement obtained of a different risetime is negligible in the common situation of measuring industry standard 6 inch coupons.
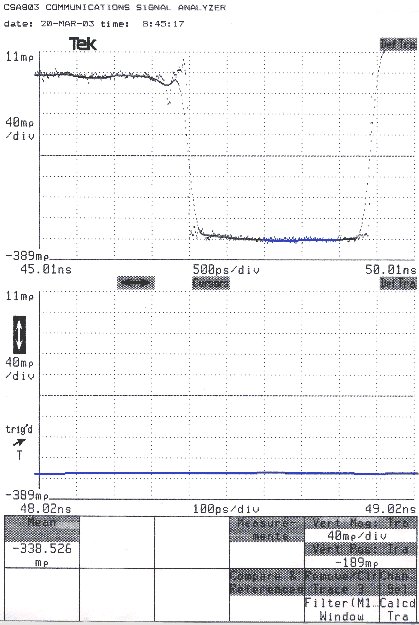
This shows the fast and slow rise time traces for a 28 Ohm nominal coupon and below the expanded measurement zone on the slow trace. The averaged measurement is –338.526 millirho ( 24.7 Ohm)
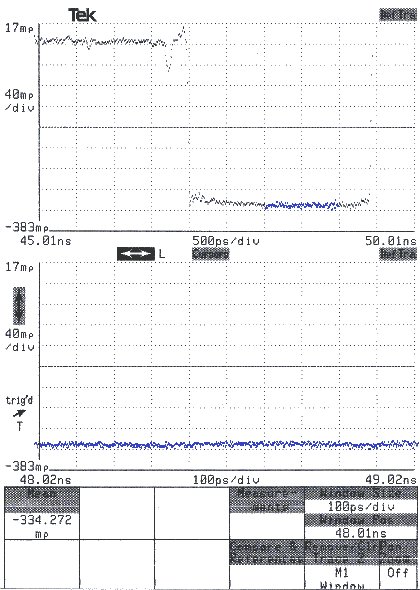
This shows the expanded measurement zone for the fast trace and the result of -334.272 millirho ( 24.9 Ohm) Appendix 1 – Deriving the impedance from the reflection coefficient The vertical axis displays in rho which is the reflection coefficient obtained by dividing the reflected voltage at any time by the incident pulse voltage.
From this the impedance can be calculated
where Zo is 50 ohm in this case. |