|
|
|
|
|
|
Surface Roughness Compensation Gradient and other methods
Application Note AP8206
|
|||
|
Choosing the right Surface Roughness Measurement Many surface roughness compensation models exist to help designers and fabricators model the effect that copper roughness has on insertion loss. Polar Si9000e provides a number of methods depending on your or your OEMs requirements. Huray (Canonball) accepts Rz or SEM data if availaible, Gradient accepts Rq (RMS) roughness – as do the legacy methods Groisse and Hammerstad which are only valid up to a few GHz Equally as important as choosing the correct model, is choosing the correct surface roughness measurement for the model input. The commonly used measurements are Ra, Rq, and Rz:
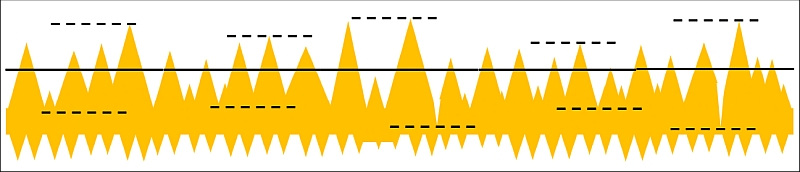
Different surface roughness compensation models will require different inputs. Some require Rz while others require Rq. It is important to note that these numbers come from different methods of summarizing a surface profile. Any numerical conversion from one method to another should be handled with care and understanding that the conversion is only an approximation and will contribute to garbage ingoing to the model. To complicate matters further, there are different ways to calculate Rz. The most common methods of calculating Rz come from the German Institute of Standards (DIN), Japanese Industrial Standards (JIS), and International Organization of Standardization (ISO). Obviously, each with their own methodology. Figure 1 shows an example of a cross section profile for a roughness measurement. The existence of various summarizing methods becomes easy to understand.
Figure 1 shows an illustration of a cross section profile. In general, Rz DIN and Rz JIS are comparable, with Rz JIS always being smaller than Rz DIN, as Rz JIS incorporates more data points. Rz ISO is not recommended as the number of data points is small. |
|||