|
|
|
|
|
|
Using the Si9000 multiple frequency loss tangent goal seek
Application Note AP8207
|
||||||
|
Using the Si9000 multiple frequency loss tangent goal seek Measuring insertion loss yields the total losses of a transmission line, but sometimes it is useful to further process that information and deduce the contribution of copper losses and dielectric losses to the overall loss figure. Si9000e provides loss tangent goal seeking for both single frequency and multiple frequencies. This note describes goal seeking for loss tangent for multiple frequencies. For single frequency goal seek see Application Note AP8193 The Si9000e simplifies the complexity of the process of estimating dielectric loss by allowing you to:
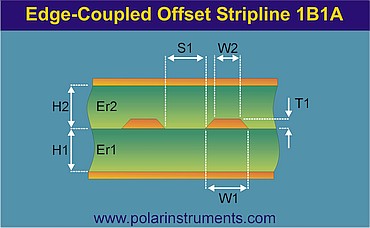
This figure can then be processed to provide a useful estimate of the dielectric loss tangent for the substrate material. Single and multiple-frequency loss tangent goal seeking Si9000e provides loss tangent goal seeking for both single frequency and multiple frequencies. For multiple-frequency loss tangent goal seeking, up to five Loss Tangent values can be calculated in a single process; the calculated results can be exported to the Extended Substrate Data Library This application note describes the sequence of steps for a multiple frequency goal seek for loss tangent Edge-Coupled Offset Stripline example Select Edge-Coupled Offset Stripline 1B1A structure:
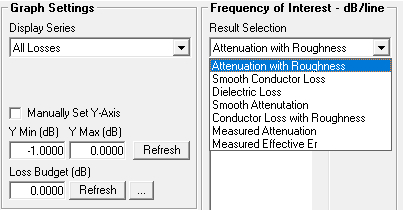
On the Lossless Calculation tab supply the structure parameters and calculate the impedance. Switch to the Frequency Dependent tab: Note: When using the Set from FOI option the Total Attenuation data will depend on the Frequency of Interest Result Selection setting on the main interface.
The readings in the example below have been derived from measured data, so for this example it will be necessary to choose Measured Attenuation from the Result Selection pane.
Result Selection
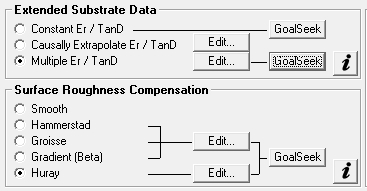
Surface Roughness Compensation From the Surface Roughness Compensation option group:
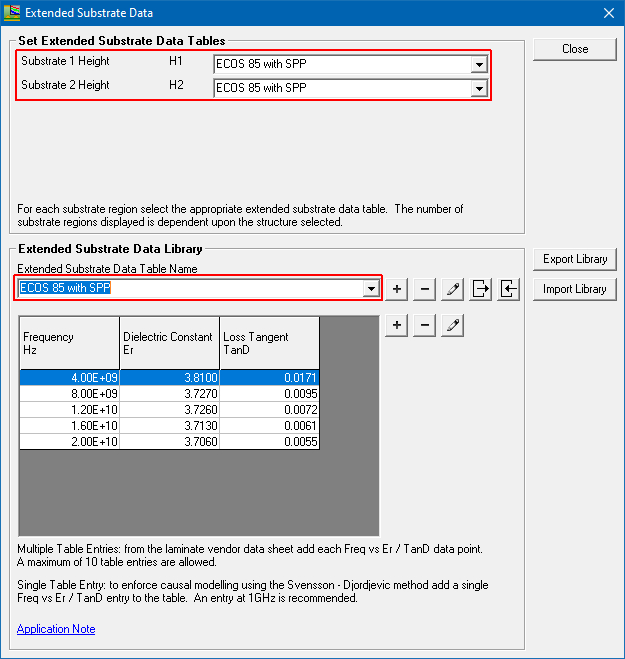
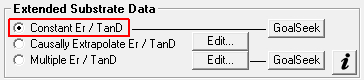
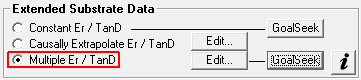
Extended Substrate Data From the Extended Substrate Data option group:
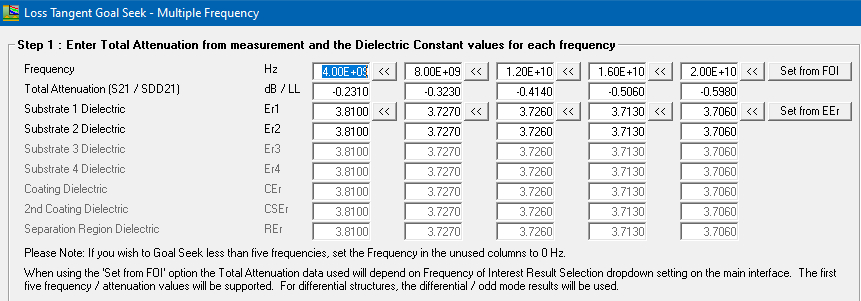
The Loss Tangent Multiple Frequency Goal Seek dialog is displayed. The dialog allows for up to five Loss Tangent values to be calculated in a single process. Input data and results are displayed simultaneously, with a separate column for each frequency. If frequencies of interest have been specified via the Frequency of Interest dialog, the first five frequencies of interest with their associated attenuation values can be added to the table via the Set from FOI button
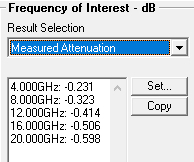
Step 1 – Enter the Total Attenuation Under Step 1, for each frequency, enter the Total Attenuation for the point of interest: the Frequency and the loss per length of line –dB / LL and the Dielectric Constant. The length of line will be the value entered into the Length of Line (LL) parameter on the main frequency dependent tab, Using the frequencies of interest
In the case of the Edge-coupled Offset Stripline 1B1A structure, the default value for LL is 10 mm – so Total Attenuation is displayed in dB/cm. The Total Attenuation is shown at each frequency. Using the Measured Effective Er
Step 2 – Calculate the Conductor and Dielectric Loss Under Step 2, Calculate the Conductor and Dielectric Loss. Si9000e will take the parameters for the current selected structure (in this case Edge-Coupled Stripline 1B1A) and calculate the conductor loss at each of the chosen frequencies. It will then take the calculated conductor loss from the total attenuation entered in Step 1 to calculate the remaining dielectric loss at each frequency. Typical results are shown below.
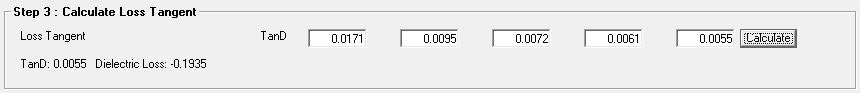
In this case the conductor loss and remaining dielectric loss for each frequency are displayed in tabular form. Step 3 Calculate Loss Tangent The Step 3 Calculate Loss Tangent option will allow the Si9000e to calculate the Loss Tangent (TanD) required to achieve the dielectric loss at each frequency as shown above. Using the Goal Seek Parameters to limit the min / max range of TanD the Si9000e will now sweep the range of TanD values until a suitable TanD is calculated to achieve the displayed dielectric loss (i.e. Attenuation – Conductor loss) at each frequency. The progress of the calculation is updated on the dialog.
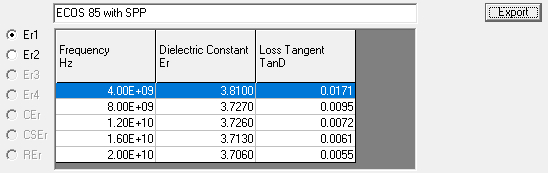
The result table above shows the Loss Tangent (TanD) required to achieve the dielectric loss at each frequency – the convergence value is used to give the target dielectric loss a tolerance. Step 4 Export results as an Extended Substrate Data table The results can be exported in tabular form as an Extended Substrate Data table. Supply a descriptive name for the table and click Export
The exported table can be specified in Extended Substrate Data calculations – select the exported table using the Multiple Er / Tan D Edit option.
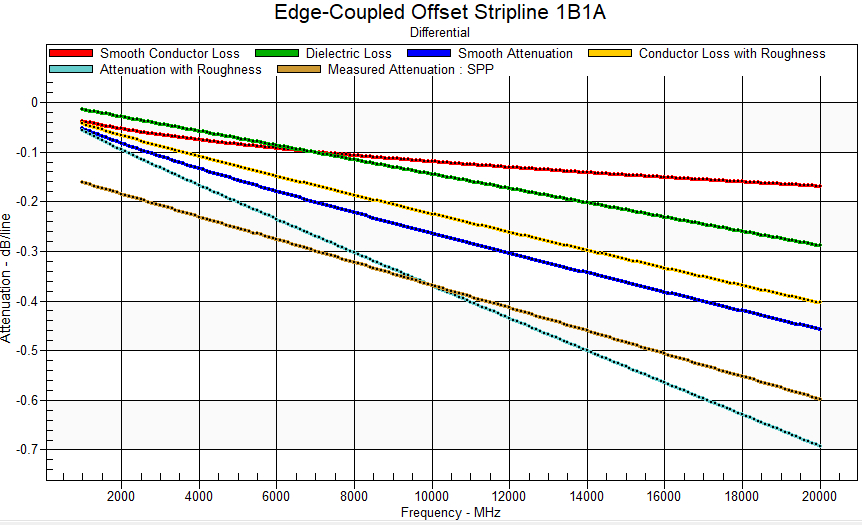
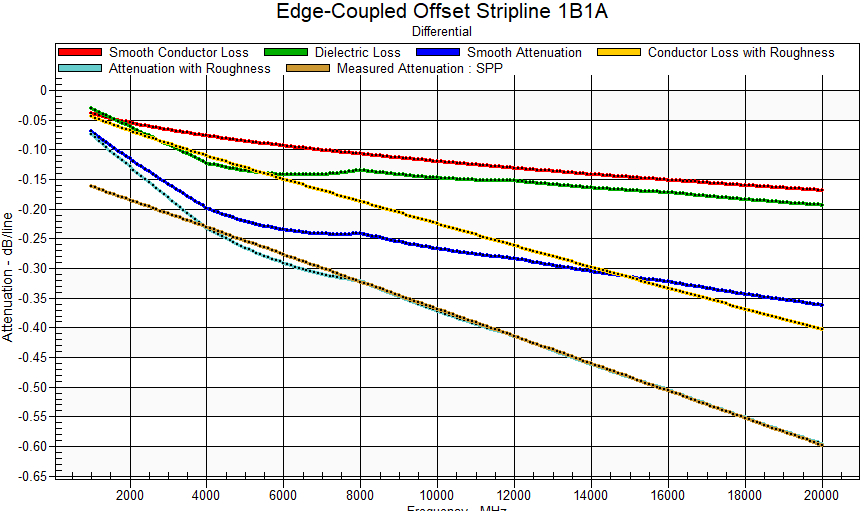
Comparing Single to Multiple Frequency Goal Seek Using the results from the single and multiple frequency goal seek as an exported extended substrate data table illustrates the improvement in the correlation between the modelled Attenuation with Roughness (cyan) and Measured Attenuation (brown). Single Frequency Goal Seek In the graph below, Attenuation with Roughness (cyan) and Measured Attenuation (brown) do not exhibit a high degree of correlation when using Constant Er / TanD mode
Constant Er /TanD goal seeking Multiple Frequency Goal Seek Once the Multiple Er / TanD Loss Tangent Goal Seek is complete, the exported results show the improvement in the correlation between the calculated Attenuation with Roughness (cyan) and Measured Attenuation (brown).
Multiple Er /TanD goal seeking |
||||||