Setting impedance test
limits so you obtain accurate results and best R&R
-
|
||
| Printer Friendly | |
|
Application
Note 141 Setting impedance test
limits so you obtain accurate results and best R&R |
|
|
|
| Printer friendly version | |
| Background Polar CITS impedance test systems are easy to set up and use. However care in setting up and understanding the test regions can yield improved measurement accuracy and better R&R First understand what is
displayed
|
Impedance test TDR trace |
|
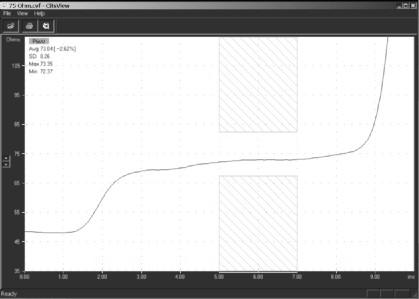
Look
now at a 75 ohm trace
|
Impedance
test TDR trace |
|
Watch out for: Setting your test points on a poor quality test coupon — it is always handy to have a set of reference impedances in the form or precision semi rigid cables to give you an idea of how an "ideal" impedance looks with your TDR. This has the added benefit of allowing you to verify your TDR is in perfect condition from time to time. Large interconnect aberrations (bumps) or dips in the end of the trace — these may be due to poor coupon design, connecting through a via with large pads, or extending the connections to the test race beyond the extents of the ground plane.
|
Hint: Measure
your coupon from both ends if possible when setting up the measurement
area. This will help you see if the coupon measures the same from both
ends. You need to check if an upward slope is because of pulse settling
time or because of trace taper.
|
|
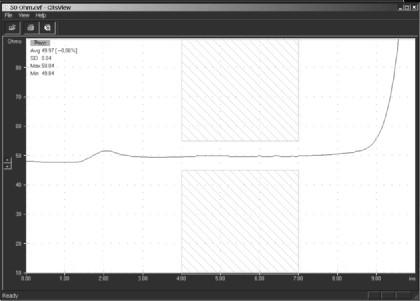
Now
lets look at a 28 ohm trace Look carefully after the first fall in the pulse, do you see a plateau before the pulse falls again and flattens out? In fact just the opposite of the effect you saw on the 75 Ohm trace. In the same way as for the 75 Ohm trace you need to wait for the pulse to fall to its minimum level before setting the test limits.
|
Impedance
test TDR trace |
|
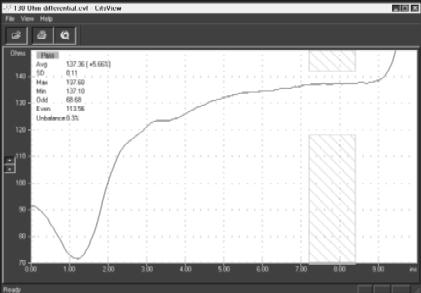
Finally, here is a 130 ohm differential trace Look from left to right along the trace, the trace enters the screen from the left, (the end of the probe) then dips down to about 70 Ohms; this dip can be caused by too large a via on the coupon, which appears as a capacitor. Certain probe configurations can also contribute to this.* The trace then rises up from the launch until it settles (in the area tested denoted by the hatched test limit area). Setting the limits before the pulse has settled means you are not accurately measuring the impedance, as your measurement will still be under reading because the TDR pulse is recovering from the large interconnect discontinuity. Please also refer back to the hint above - highlighted in yellow. *Ask your polar distributor for details of the latest IPD probes which can help minimise this launch discontinuity.
|
Impedance
test TDR trace |
| If
you would like to view the above TDR traces in more detail, you can
install the CITS View software free from the downloads section of this site.
Install, then view the following files:
50
Ohm.cvf |
|
| Modifying
designs. It is important to maintain a good dialog between the original designer of impedance controlled boards and the fabricator. To assist in this process the Polar Si6000b field solving impedance design system can goal seek new values and graph sensitivity to changes in build parameters. You can also use the Si6000 to graph predicted impedance over distance as described in the above article. |
|
| More
information? Further information on measuring PCB controlled impedances is available by email from richard.smith@polarinstruments.com For information on field solving impedance design software please contact: ken.taylor@polarinstruments.com |
|
|
|
|
Polar Instruments Ltd polarinstruments.com Tel: +44 1481 253081 Fax: +44 1481 252476 © Polar Instruments 2002 |
 |
|
|
|
| © Polar Instruments 2002. Polar Instruments pursues a policy of continuous improvement. The specifications in this document may therefore be changed without notice. All trademarks recognised. | |