|
|
|
|
|
|
CITS test methods
Application Note AP8515
|
|||
|
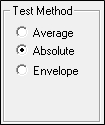
CITS test methods The CITS provides for several test methods to accommodate traces with different characteristics: The CITS test methods include Absolute, Average, Envelope and Launch Point Extrapolation (LPE). The Envelope method is for specialist applications. The test method is supplied as a parameter of the CITS test file.via the Test File Editor. The Absolute test method is the preferred test method and is selected by default.
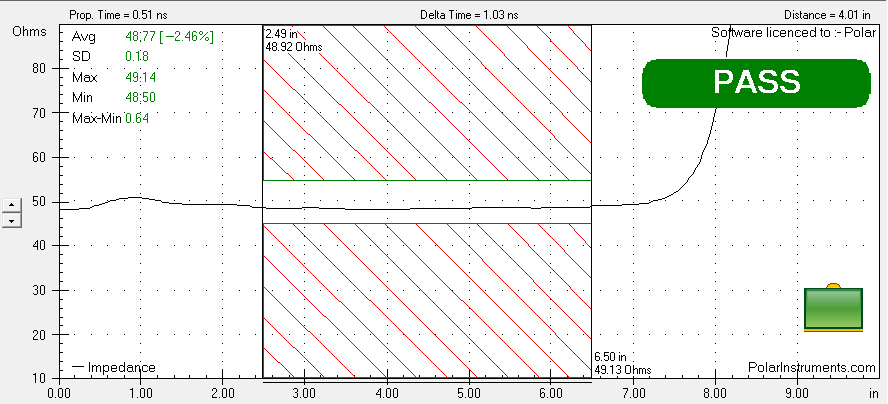
Absolute test method (preferred) When the Test Method parameter is set to Absolute the CITS will record an PASS if the trace falls between the limits set by the Tolerance settings or a FAIL if the trace waveform crosses the FAIL threshold (i.e. touches the crosshatch area of the test limits) at any point over the tested area.
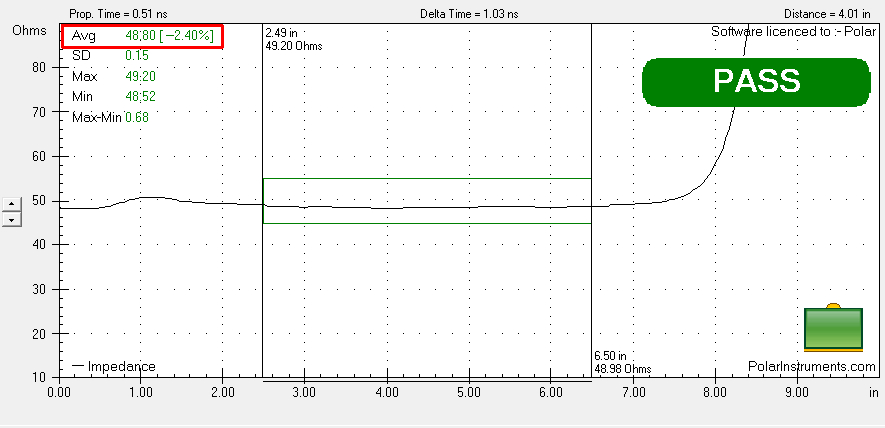
Absolute Test Method display window For traces exhibiting an upward slope from left to right see Launch Point Extrapolation (below.) Average test method (retained for legacy applications) The Average method sums the value of all the points within the horizontal test limits and divides by the number of points in that interval. The Average test method is a method which was used for legacy backplanes. It was found useful when large numbers of via holes were likely to disturb the PCB trace impedance waveform. It is included from the days when risetimes were slower and backplanes designed with higher nominal impedance for the trace and the via capacitance used to “pull” the average line impedance down. Selecting Average will cause the test to fail only if the average impedance value (shown in the top left of screen statistics box) is out of tolerance. For example, consider a trace test specifying 50 ohms nominal impedance ±10% between 2.5 inches and 6.5 inches. If the Average test method is selected the test limits are displayed as shown in the diagram below:
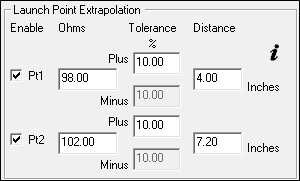
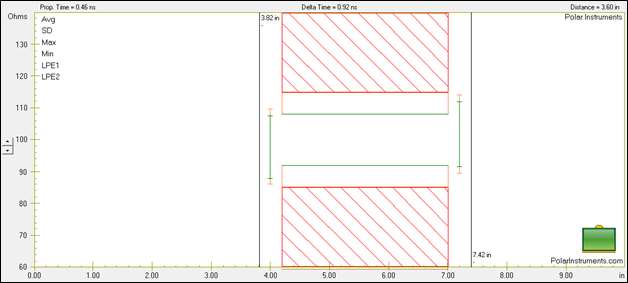
Average Test Method display window Average method should only be used with the express approval of the specifying authority. Launch point extrapolation (LPE) With thinner copper and finer PCB traces, TDR traces are often seen exhibiting an upward slope from left to right, the trace gradient increasing for fine trace widths or as the copper layer gets thinner. As the TDR reflection returns to the measurement system, a combination of DC and AC trace resistance adds to the reflection of the instantaneous impedance resulting in an upward sloping trace. Measuring instantaneous impedance on the CITS880s The impedance calculated with a field solver is the instantaneous impedance, i.e. the impedance (if it were possible to slice through any point on the trace and apply an ideal TDR pulse) at the point of launch into the trace section. Launch point extrapolation applies a regression line fit to a stable sample of the reflection from the trace and projects this regression line back to the launch of the trace. LPE method is appropriate for fine lines and thin copper where there is significant DC resistance in the trace.This technique requires a TDR with as flat a pulse as possible and, ideally, minimum leading edge perturbations. CITS880s supports this technique in addition to conventional impedance measurements for less challenging geometries. LPE is IPC approved but should be used in conjunction with the express clearance of the specifying authority. CITS Launch Point Extrapolation (LPE) To define LPE limits, in the CITS Test Editor click Enable for each of the points and define the target impedance for each point. The CITS uses the values defined in the Tolerance section of the Test Editor window to set the LPE limits. Note that in the example below an optional Intermediate guard band (shown in green) has been defined.
Note: the test limits and time position of the launch point and end point extrapolation are the primary responsibility of the PCB specifier and fabricators should seek their customers' guidance if in any doubt.
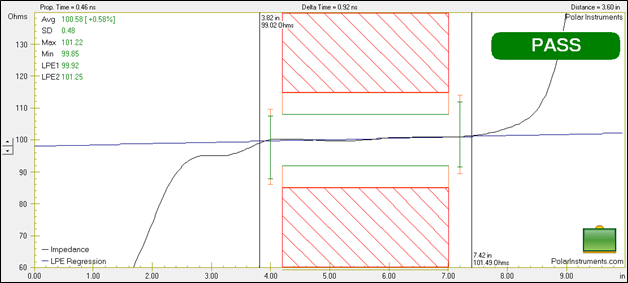
Launch Point Extrapolation settings As the test is run the CITS calculates and displays the slope of the trace over the test region and extends the line through the extrapolation points, fitting the line to a regression calculation of the data points between the Test From and Test To distances.
|
|||