|
|
|
|
|
|
Si9000e Modeled v ATLAS & VNA Measured Insertion Loss Correlation
Application Note AP8182
|
|
Objective The Si9000e – ATLAS & VNA Modeled v Measured Insertion Loss Correlation Study assesses the correlation between insertion losses predicted by the Si9000e transmission line field solver and associated test results obtained from the following single ended and differential test methods:
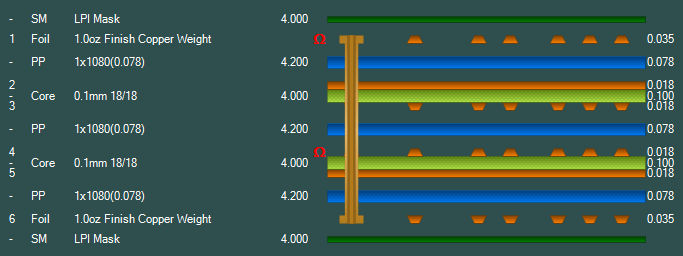
Method Three PCBs (test coupons) were manufactured using industry standard Gerber data generated with the Polar CGen Coupon Generator (V14.02) The coupon stackup is shown (using Polar Speedstack v 14.09) below.
Each coupon contained the following test traces:
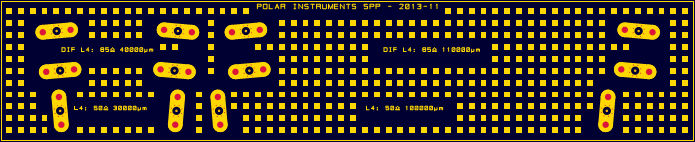
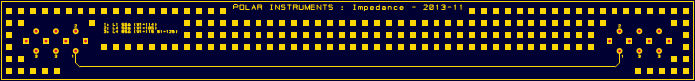
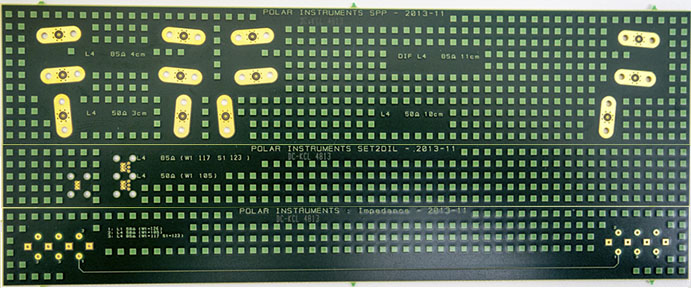
The SPP, SET2DIL and impedance sections of the coupon (shown below) were generated with Polar CGen coupon generator v14.02
SPP test area
SET2DILtest area
Impedance test area The fabricated test coupon is shown below.
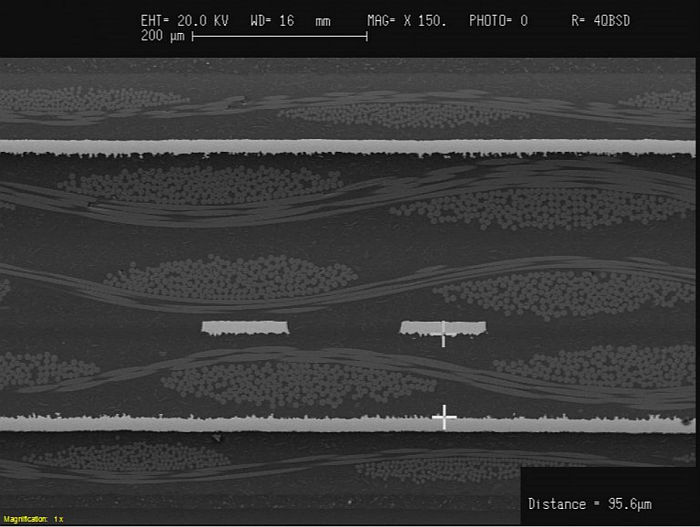
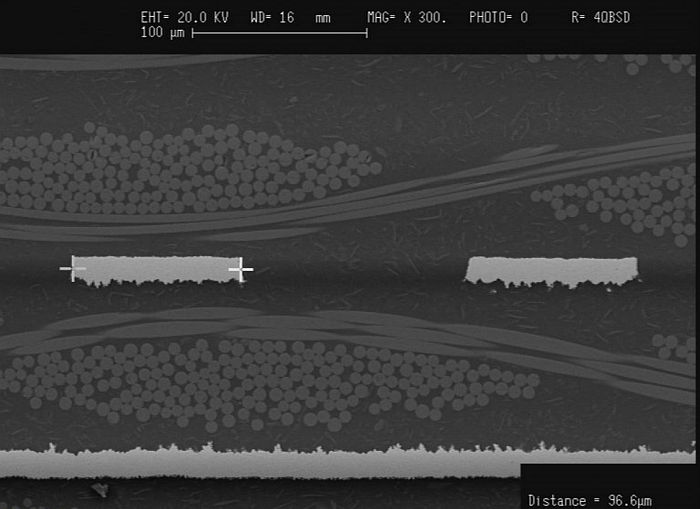
Loss modeling with the Si9000e Insertion loss prediction, from design data and sectioning data measured with a scanning electron microscope, was provided by Polar Instruments Si9000e insertion loss GHz PCB transmission line field solver modelling software (V13.02) Scanning electron microscope cross section inspection was performed by Spur Electron Limited, Havant, Hampshire, UK. Cross section images of a test coupon are shown below; dimensions obtained from the cross sections were used in subsequent modelling in the Si9000e.
SEM coupon cross section (trace height)
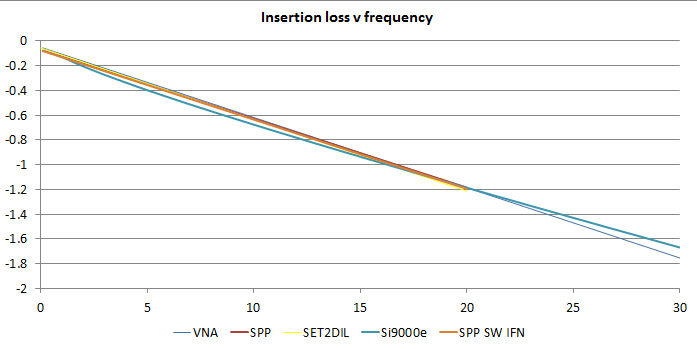
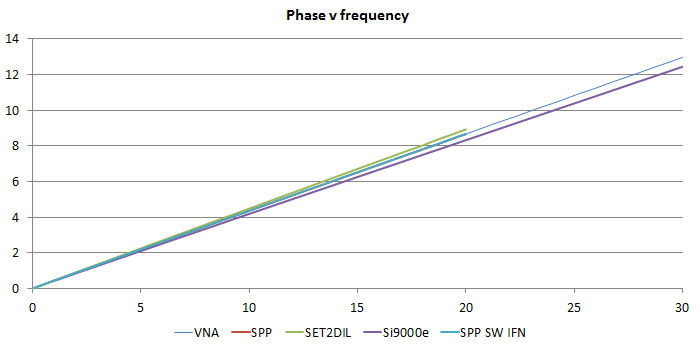
SEM cross section – detailed view (trace width) Testing The VNA portion of the work was conducted by the UK's National Physical Laboratory (UK equivalent of NIST) using fully traceable VNA equipment. SPP, SET2DIL, SET2SEIL and impedance testing was performed with Polar ATLAS Insertion Loss Test System software (V14.04) using a Tektronix DSA8300 with 80E04 sampling modules and Polar ATLAS 800 ESD Protection Module. SPP tests were performed both with PicoSecond Pulse Labs 5208 Impulse Forming Networks (IFN) and with Polar software modelled IFNs. Graphical results Raw data results were transferred for comparison and presentation to Microsoft Excel: spreadsheets were generated for both single ended and differential data and resulting graphs plotted. The charts show measured data for VNA, SET2DIL and SPP, both with hardware IFNs (SPP in the charts) and with software modelled IFNs (charted as SPP SW IFN.) Predicted loss (charted as Si9000e) and measured results for all test methods (VNA, SPP, SET2DIL and SPP SW IFN) for a typical coupon correlation test are shown below. Regression data are shown normalised to loss/10mm v frequency in GHz, phase results are shown as rad/10mm v frequency in GHz. Si9000e modeling and VNA test results are shown to 30 GHz, SPP, SPP SW IFN and SET2DIL are shown to 20GHz (the sampling bandwidth limit of the DSA8300/80E04 TDR system employed.)
Regression fit data (loss/10mm v frequency in GHz)
Phase (rad/10mm v frequency in GHz) Conclusion The charts of combined data show that up to the measured bandwidth of 20GHz the correlation between modelled loss and associated measured results is good. The data sets using the software and hardware impulse forming networks show extremely good correlation, with the data sets in most cases overlying each other directly. |