|
|
|
|
|
|
Considering the effects of TDR pulse risetime on PCB impedance measurements
Application Note AP8197
|
|||
|
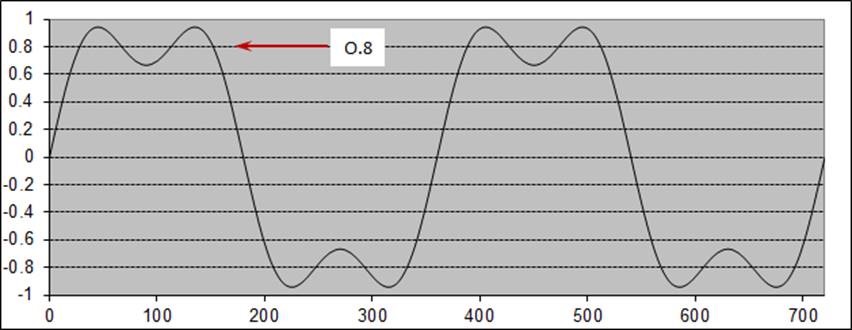
Measuring PCB impedance using time domain reflectometry (TDR) For TDR based calculations of PCB trace characteristic impedance a step pulse is injected onto the trace (usually a representative trace, not on the board itself, but on a test coupon manufactured at the same time and on the same panel as the PCB) and the characteristic impedance of the trace is calculated from the amplitude of the pulse reflected at the interface of the trace and the TDR. Perhaps surprisingly to you (or not) PCB transmission line characteristic impedance hardly changes at all with frequency, it is an intrinsic property of the structure. Impedance measurements of PCB traces using TDR (time domain reflectometry) support this fact. For a fast risetime pulse, its Fourier transform will show higher frequency harmonics than a pulse with a slower risetime, but when testing in the time domain – all the harmonics of the pulse are reflected together and the reflection is a composite of all its frequencies. With a TDR the average height of the reflection is observed. Look at the following models – and what happens to the average pulse height as more and more high frequency content is added: The graphic below shows the addition of a fundamental and its 3rd harmonic:
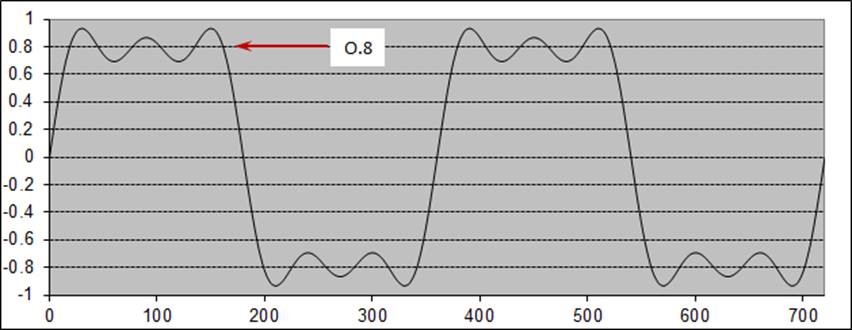
Now the 5th harmonic is added:
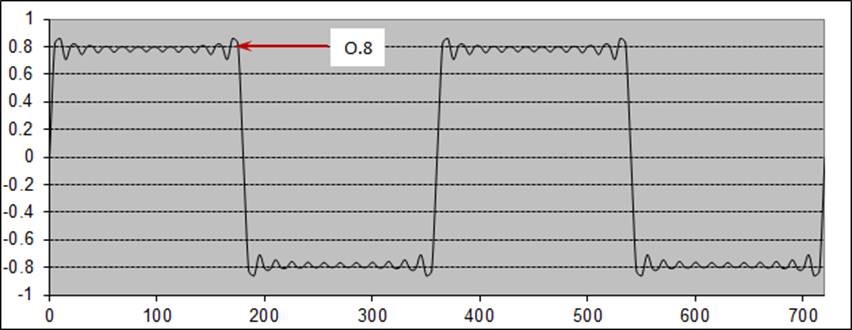
Now all harmonics up to 23rd are added:
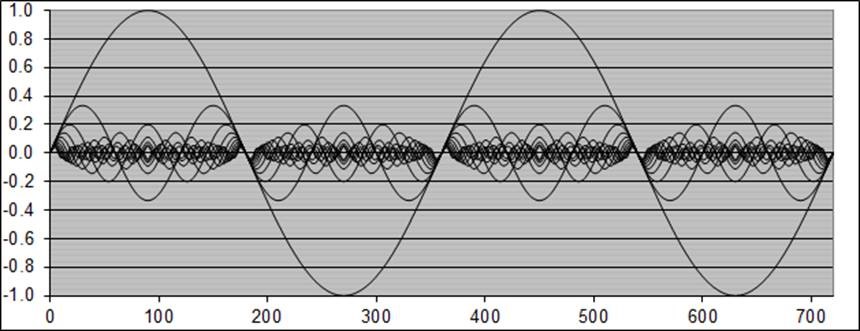
Looking at all the component sine waves up to 23rd harmonic before they are added…
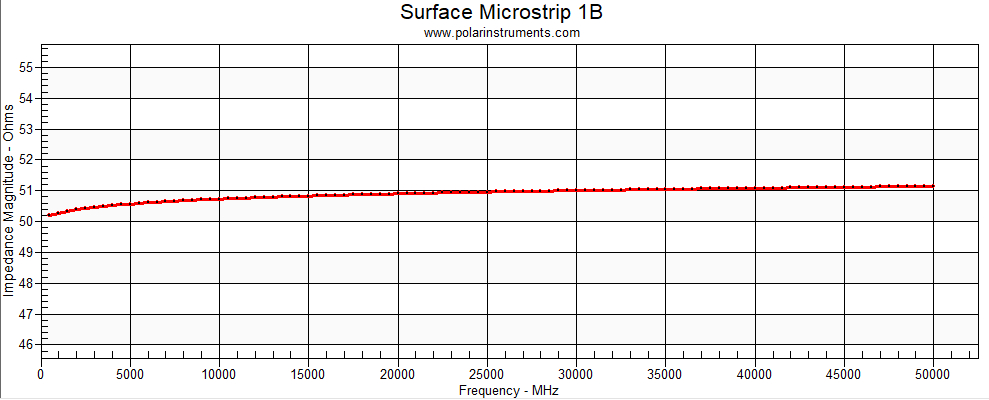
The higher harmonics make the reflection flatter but they do not change the amplitude of the reflection. The Polar Si9000e graphic below models the characteristic impedance from 500 MHz to 50GHz
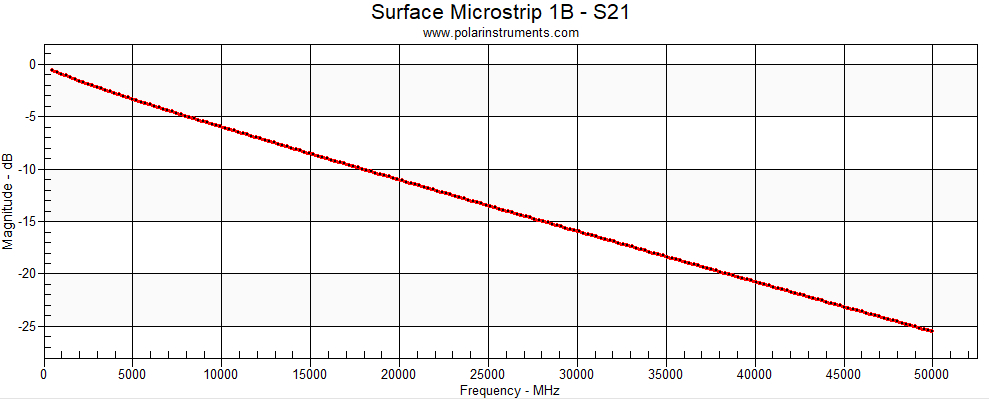
For this model dielectric and skin effect are taken into account – you can see the modeled change is less than an Ohm – this is less than the normal process variation. For more details see AP8190 Impedance variation with frequency can be counter intuitive! Are there any benefits in testing at higher frequencies? So you might be asking, Why do people need to test at higher frequencies? The answer is that the insertion loss does change with frequency, but if you are only interested in testing the characteristic impedance, then a faster risetime will make little difference to your result. A faster risetime may help, however, in providing higher resolution and revealing local impedance variations and discontinuities caused, for example by local variations in Er caused by fibre weave patterns and glass/resin ratios. Testing for insertion loss does, then, require a faster rise time TDR – and the software to extract the insertion loss. Polar achieves this with its Atlas product combined with a Tektronix DSA8300 TDR – along with specially designed coupons and more expensive probing solutions. The graphic below illustrates insertion loss vs frequency modeling with the Polar Si9000e:
Insertion loss increases progressively as frequency rises and designers either have to keep these traces short – or move to more expensive base materials. In short, if you or your customer are measuring characteristic impedance the measurement is independent of TDR risetime. This is also demonstrated by Application Note AP168 Effect of risetime on the TDR measurement of impedance which shows a Tektronix TDR measuring impedance with both a 35ps risetime pulse and a 200ps rise time pulse. The measurement is the same with both risetimes. |
|||